College of Health Professions
View Related Pages
Student Admissions, Outcomes, & Other Data
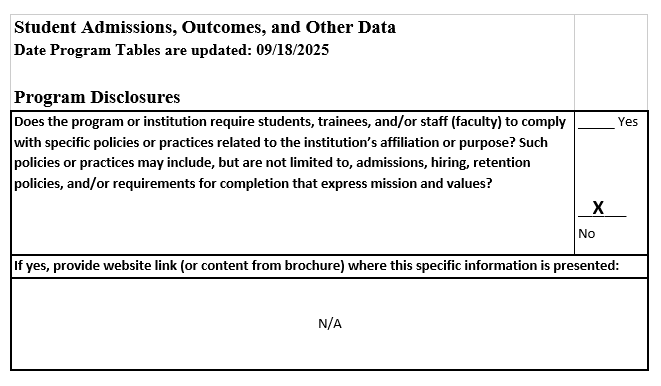
Program Disclosures
Time To Completion for all students entering the program
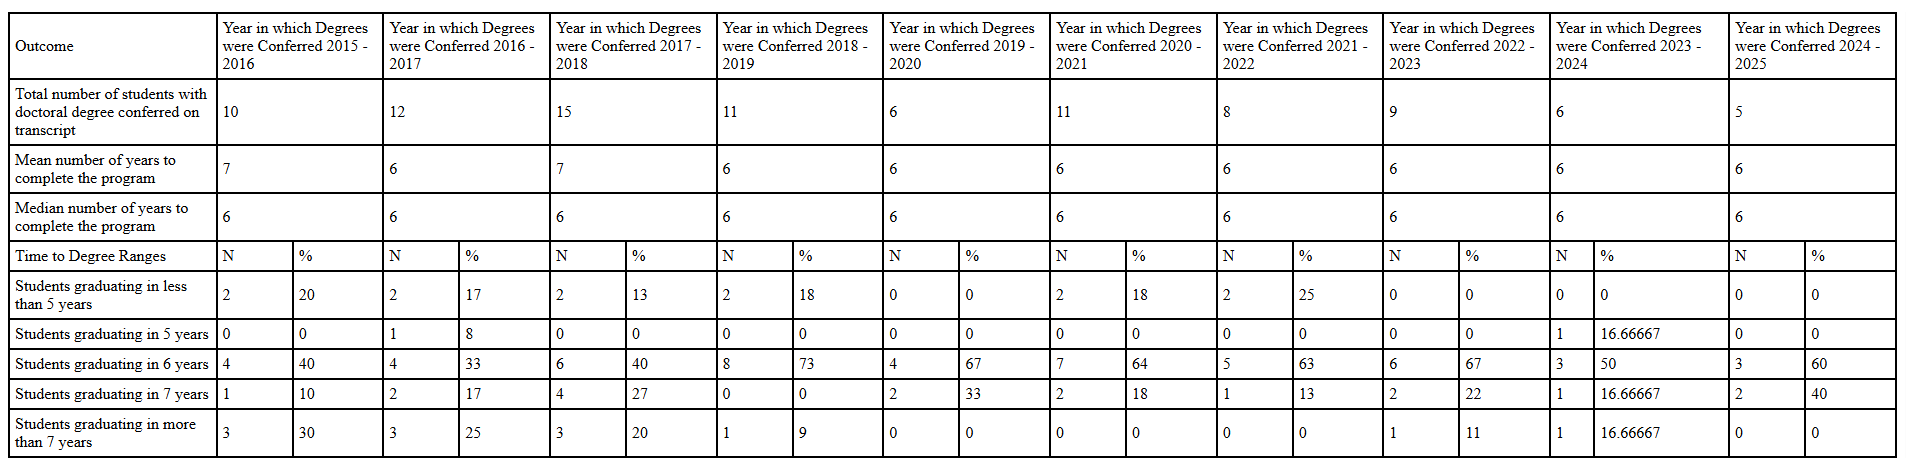
Degree conferral period runs September 1st - August 31st for each academic year reported.
Information on program admissions policies that allow students to enter with credit for prior graduate work, and the expected implications for time to completion is located on pages 43-46 of the department's policy and procedures manual.
|
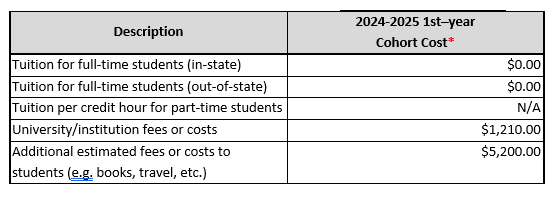
Program Costs*
|
| *Students receive a 100% tuition waiver for 4 years and do not pay tuition after year 4. In addition to this, assistantships are available to help defray costs. Students receive a research assistantship for at least 3 years. All students entering in Fall 2024 received a research assistantship of $10,000 for the 2024-2025 academic year. Other miscellaneous work study positions are also available within the department and through other programs in the school. For current tuition and fees costs prior to the tuition waiver, please refer to the tuition table located at https://dev.rosalindfranklin.edu/admission-aid/financial-services/tuition-fees/psychology-phd/ |
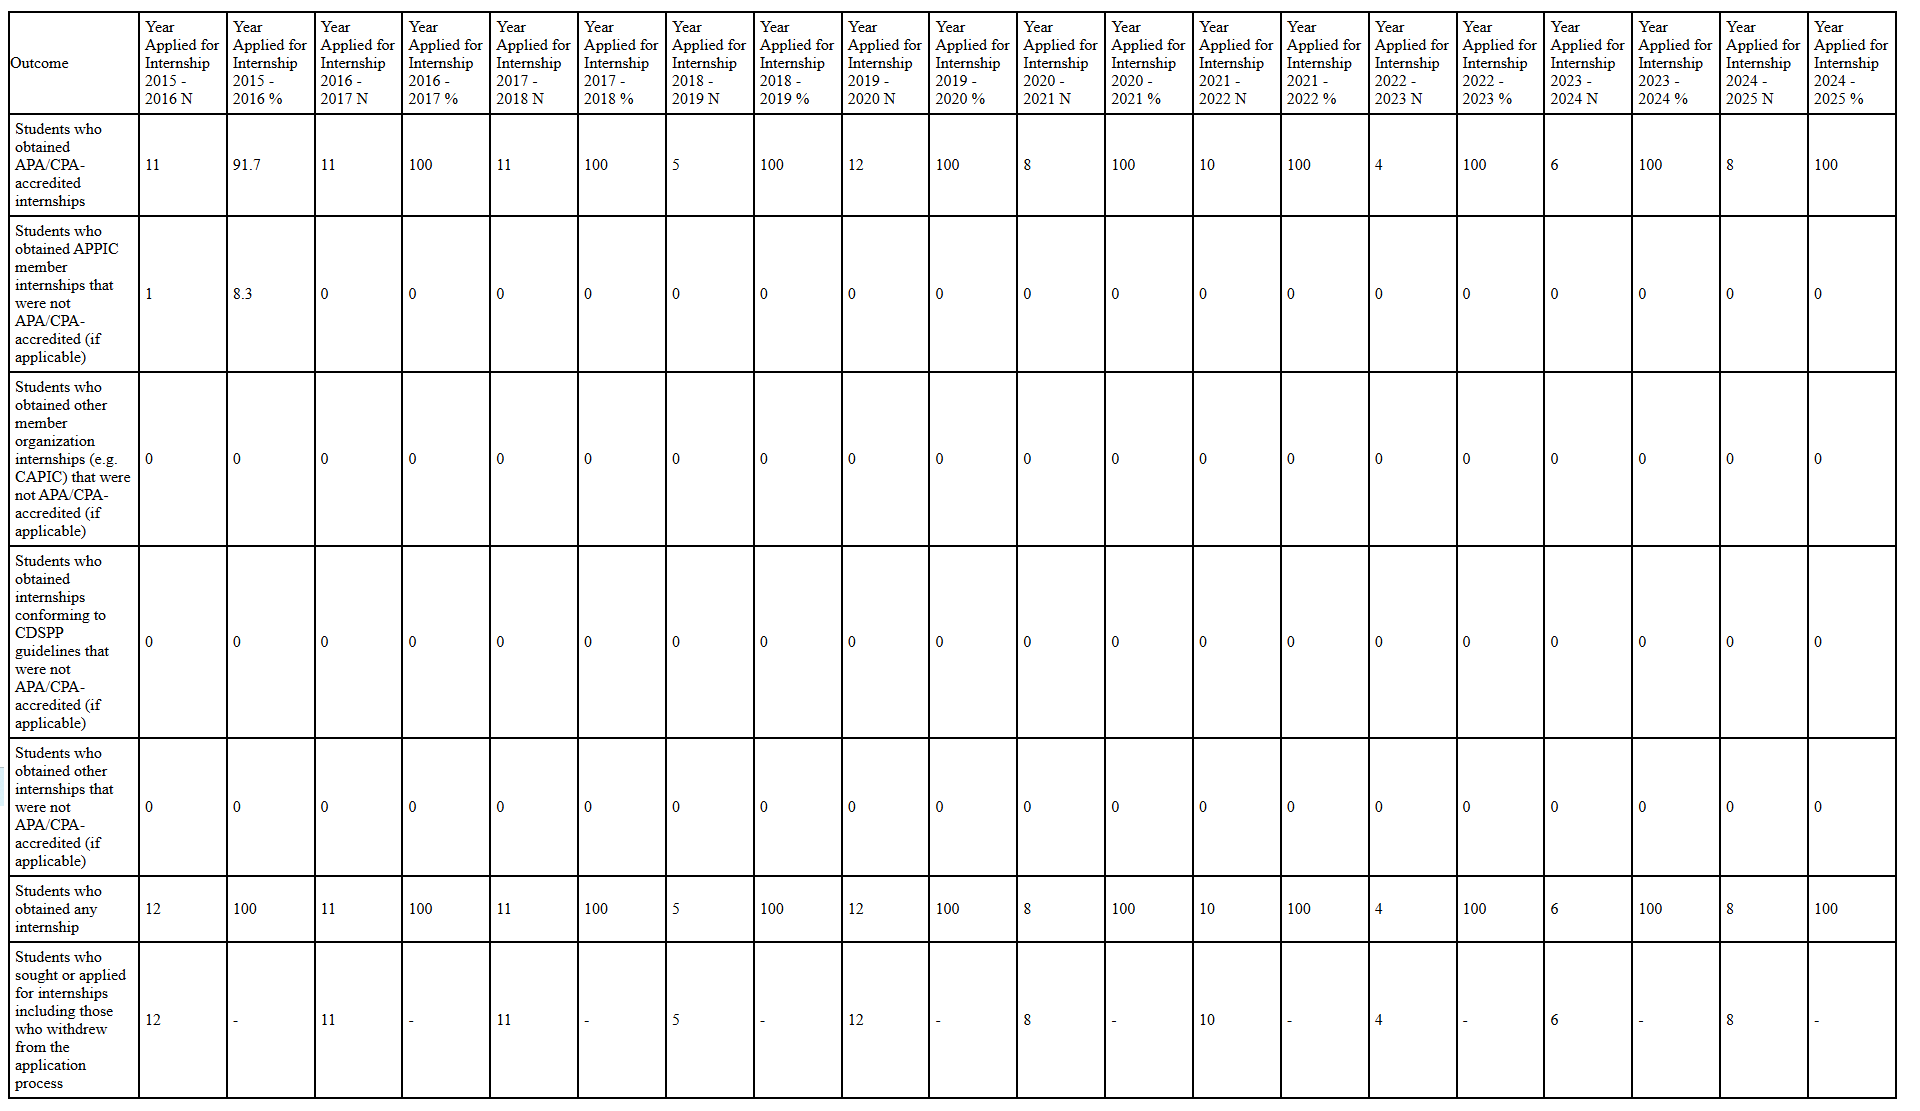
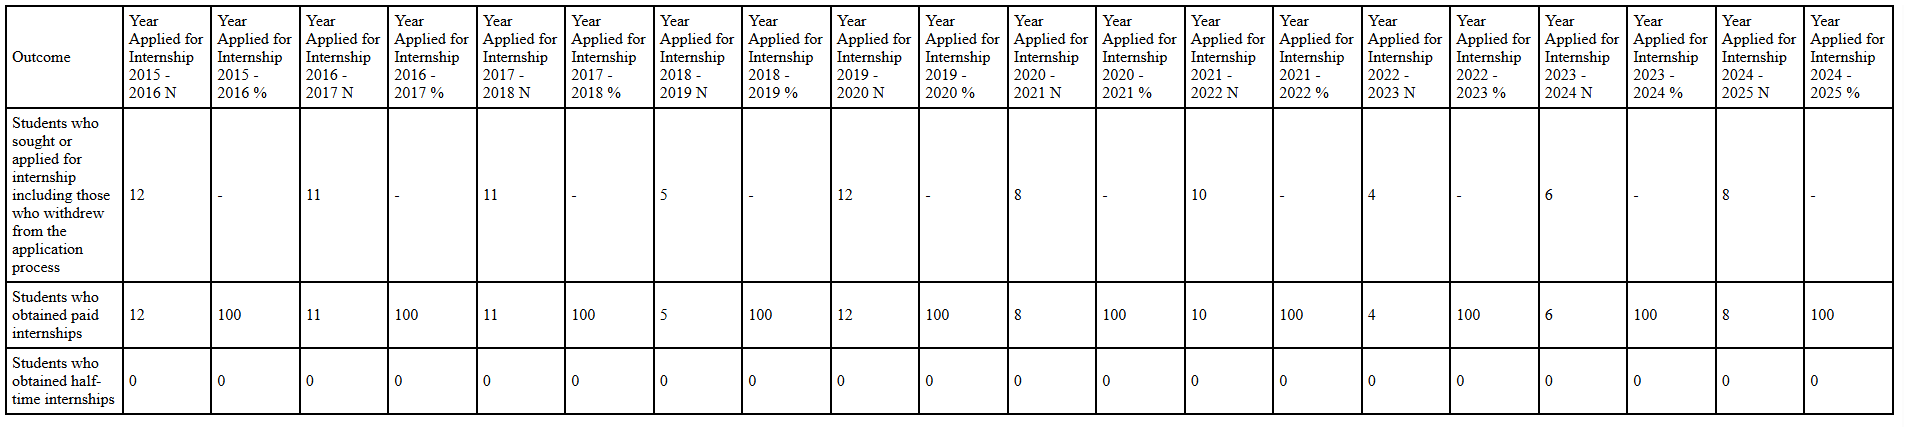
Internship Placement - Table 1
Internship Placement – Table 2
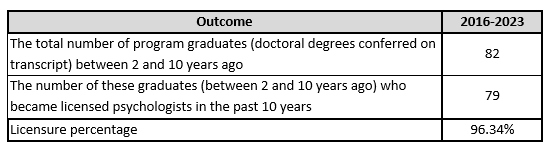
Licensure
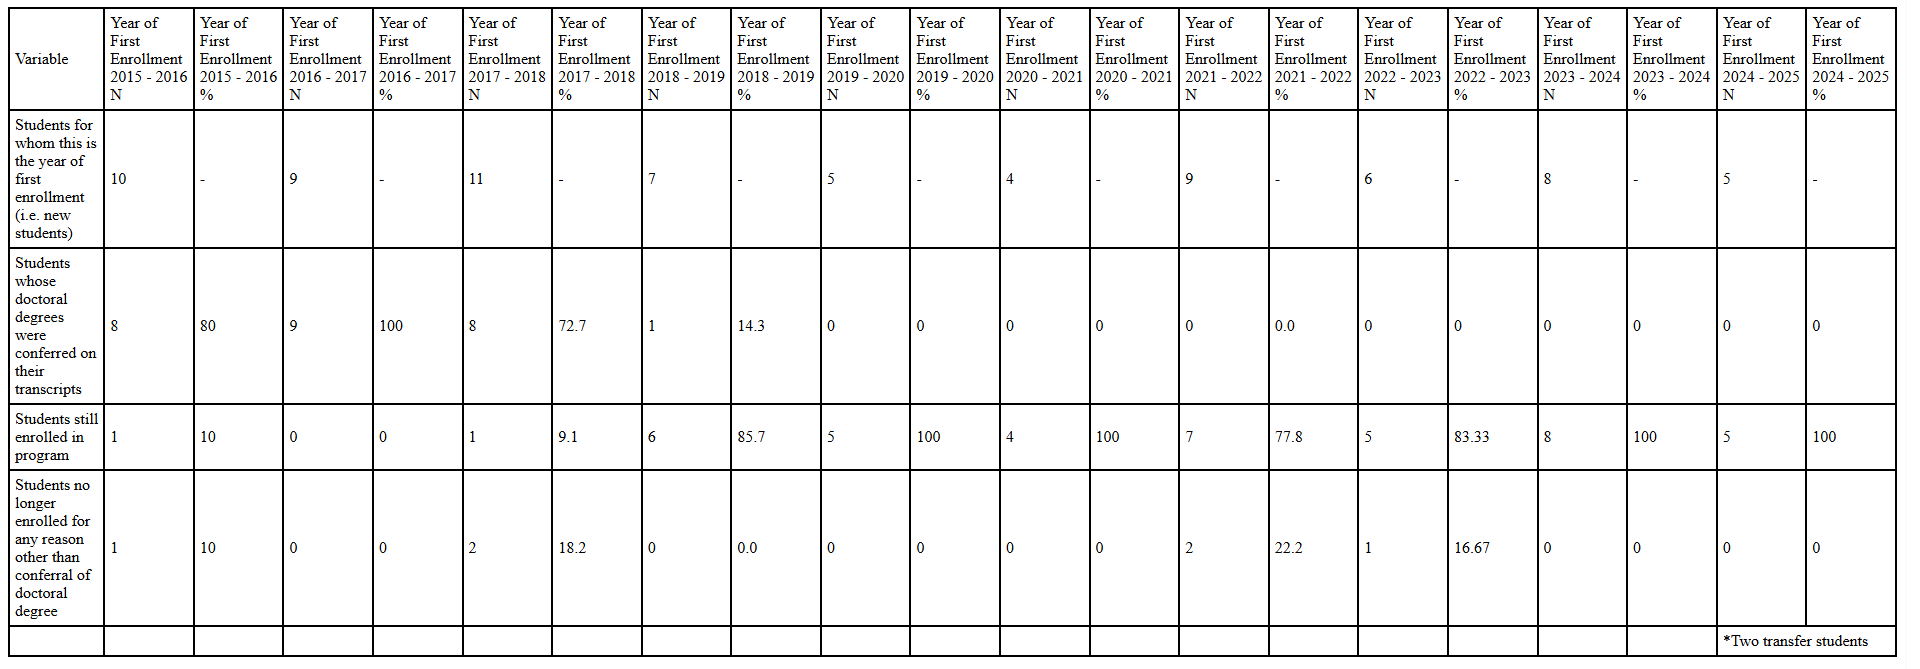
Attrition
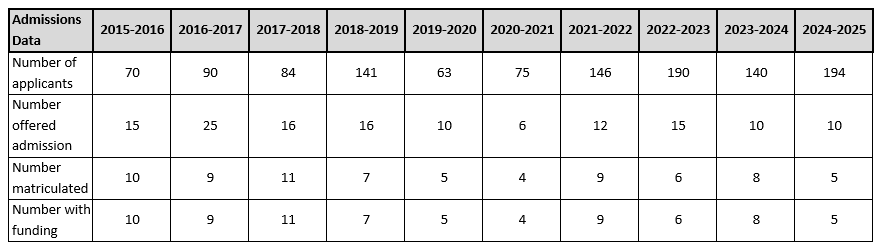
Admissions Data
View the raw data in this pdf